
Evidence Layers
The Data Layers Behind Every Site Assessment
Ground Deformation (InSAR)
Historical ground deformation and subsidence context derived from radar satellite analysis and calibrated with proprietary GNSS ground station networks.
Hazard Modelling & Grading
Deformation data feeds through KorrAI’s proprietary hazard grading algorithms to generate risk scores.
Trends & Causal Correlation
Our Agentic platform, TRAIL, identifies and interprets movement patterns with time-series deformation analysis and helps correlate events.
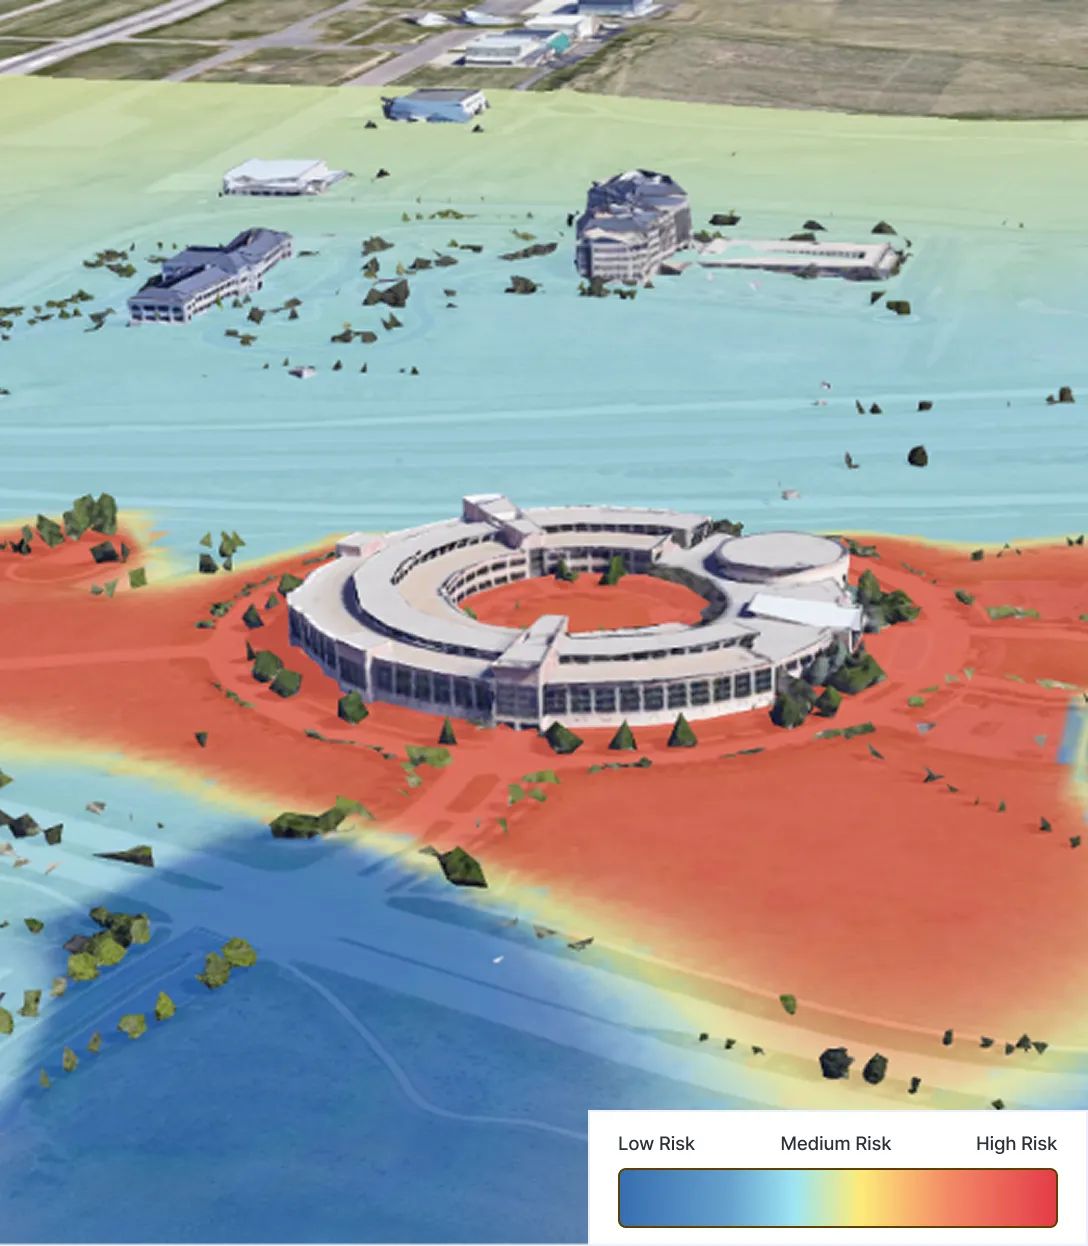
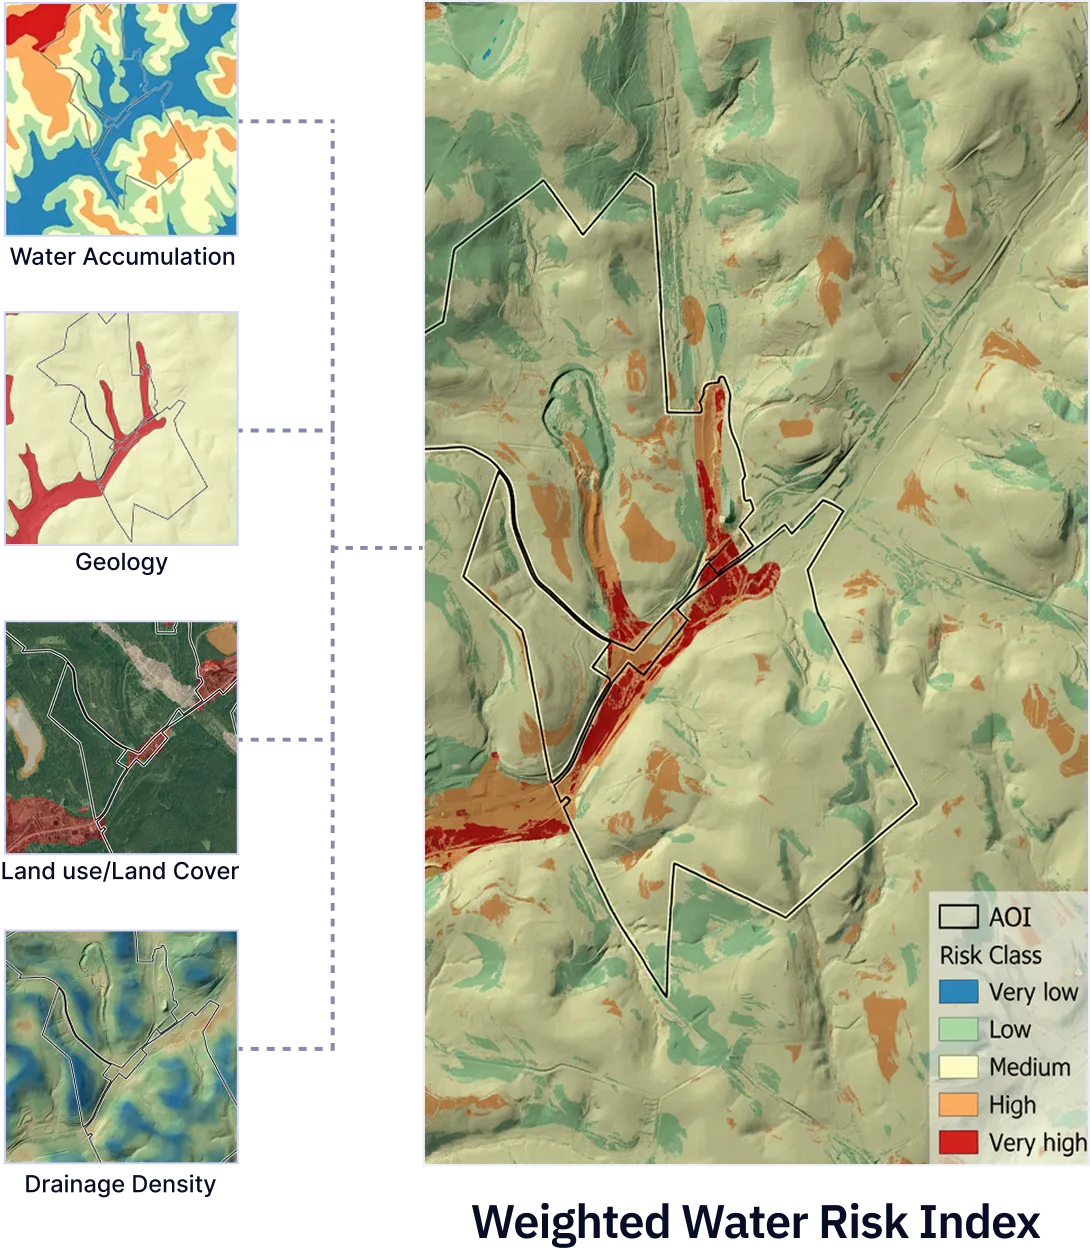
Water & Drainage Risk
Groundwater recharge, infiltration, and uplift potential derived from hydrologic, soil, slope, and geological layers.
Recharge Analysis
Modeling groundwater recharge rates based on precipitation, soil permeability, and topographic factors.
Infiltration Modeling
Analyzing surface-to-subsurface water movement patterns relevant to saturation and stability.
Uplift Potential
Assessing hydrostatic pressure context and potential for foundation uplift in high water table areas.
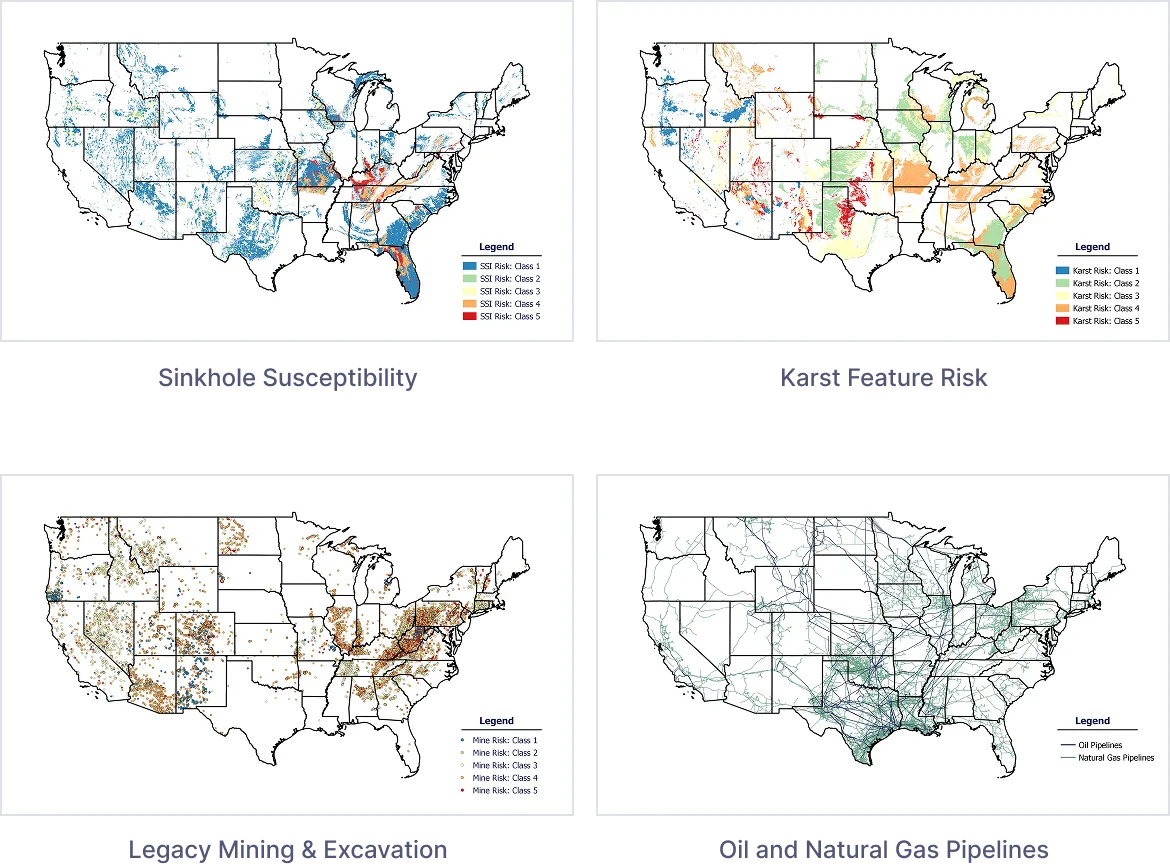
Geology & Subsurface
Surface what site surveys miss: probability of underground voids, abandoned mines, pipelines.
Sinkhole & Karst Exposure
Documented sinkholes and dissolution-prone limestone terrain where sudden ground collapse threatens foundations and structures.
Legacy Mining Proximity
Active and abandoned mines where historical extraction creates subsidence zones and potential contamination.
Pipeline Setbacks
Oil and gas pipeline corridors that impose regulatory buffers, special permitting requirements, and safety considerations for construction.
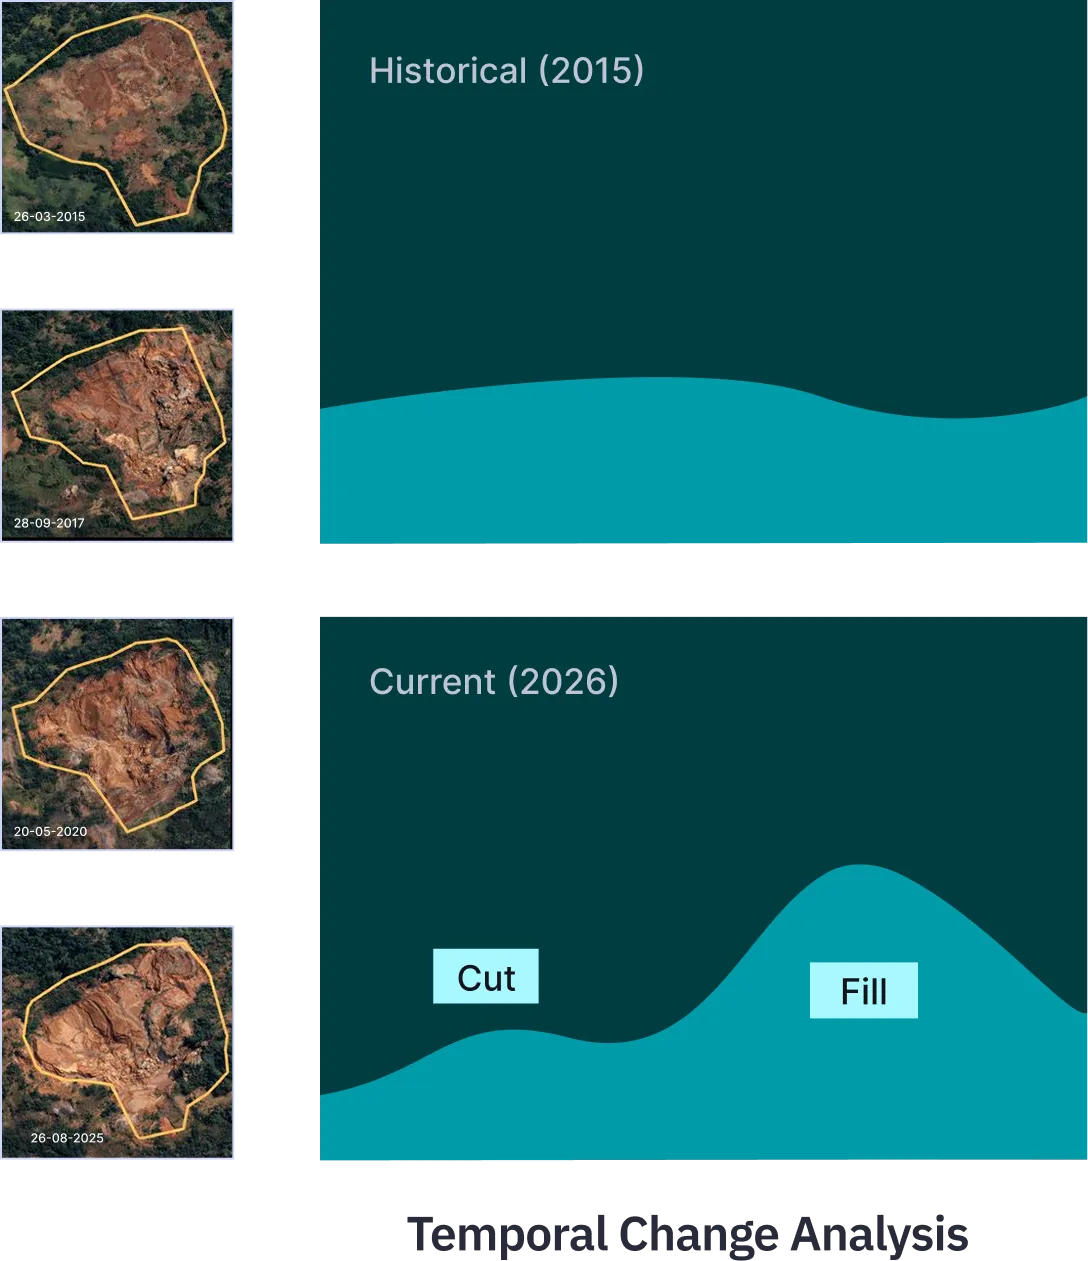
Site Evolution
Decadal cut/fill changes, landform modification, undocumented grading, and earthwork disturbance signals from historical analysis.
Cut/Fill Detection
Analyzing elevation changes over decades to identify areas of significant earth movement and fill placement.
Landform Modification
Tracking changes to natural drainage patterns, slope profiles, and terrain features over time.
Undocumented Grading
Identifying historical earthwork activities that may not appear in official records but impact site stability.
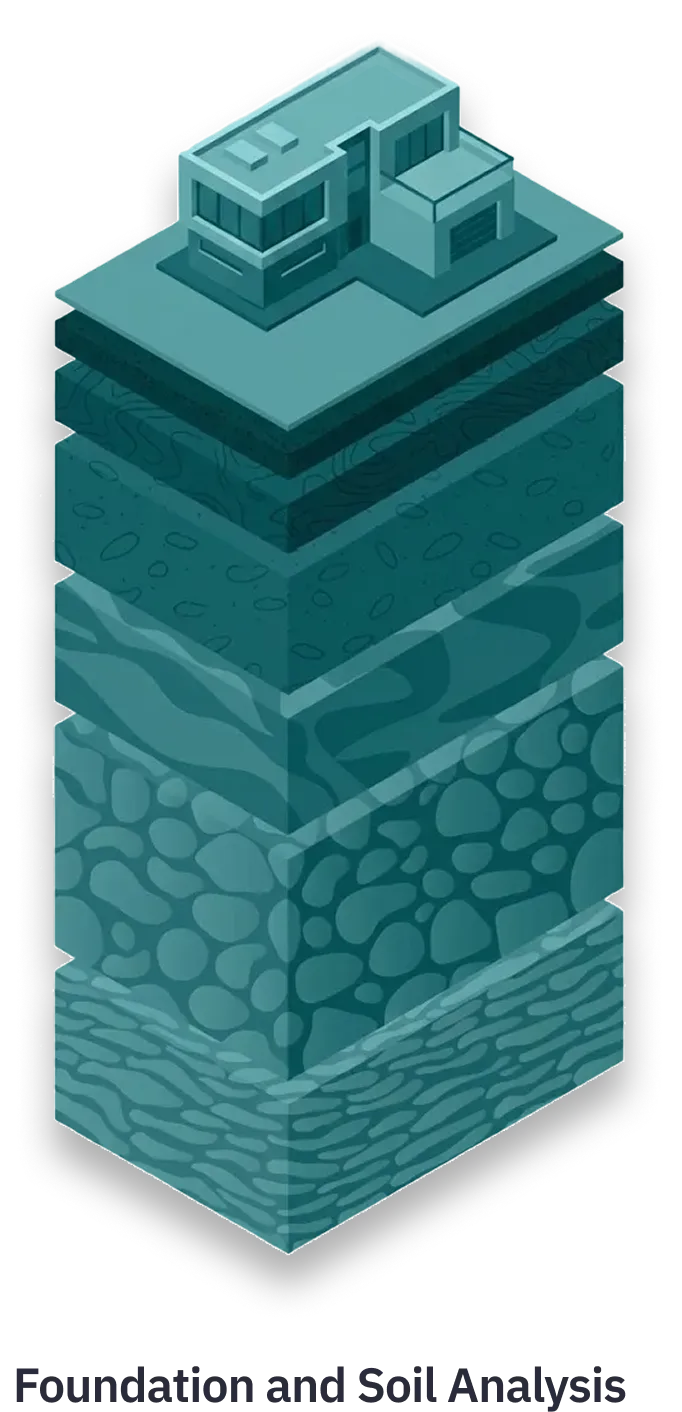
Piling & Foundations
Indicators of soil variability, compressibility, and foundation sensitivity derived from terrain, deformation, and geological analysis.
Soil Variability
Identifying lateral and vertical variations in soil composition that affect pile bearing capacity.
Compressibility Analysis
Assessing settlement potential and consolidation characteristics for deep foundation design.
Foundation Sensitivity
Evaluating terrain motion patterns and geological features that impact pile performance.
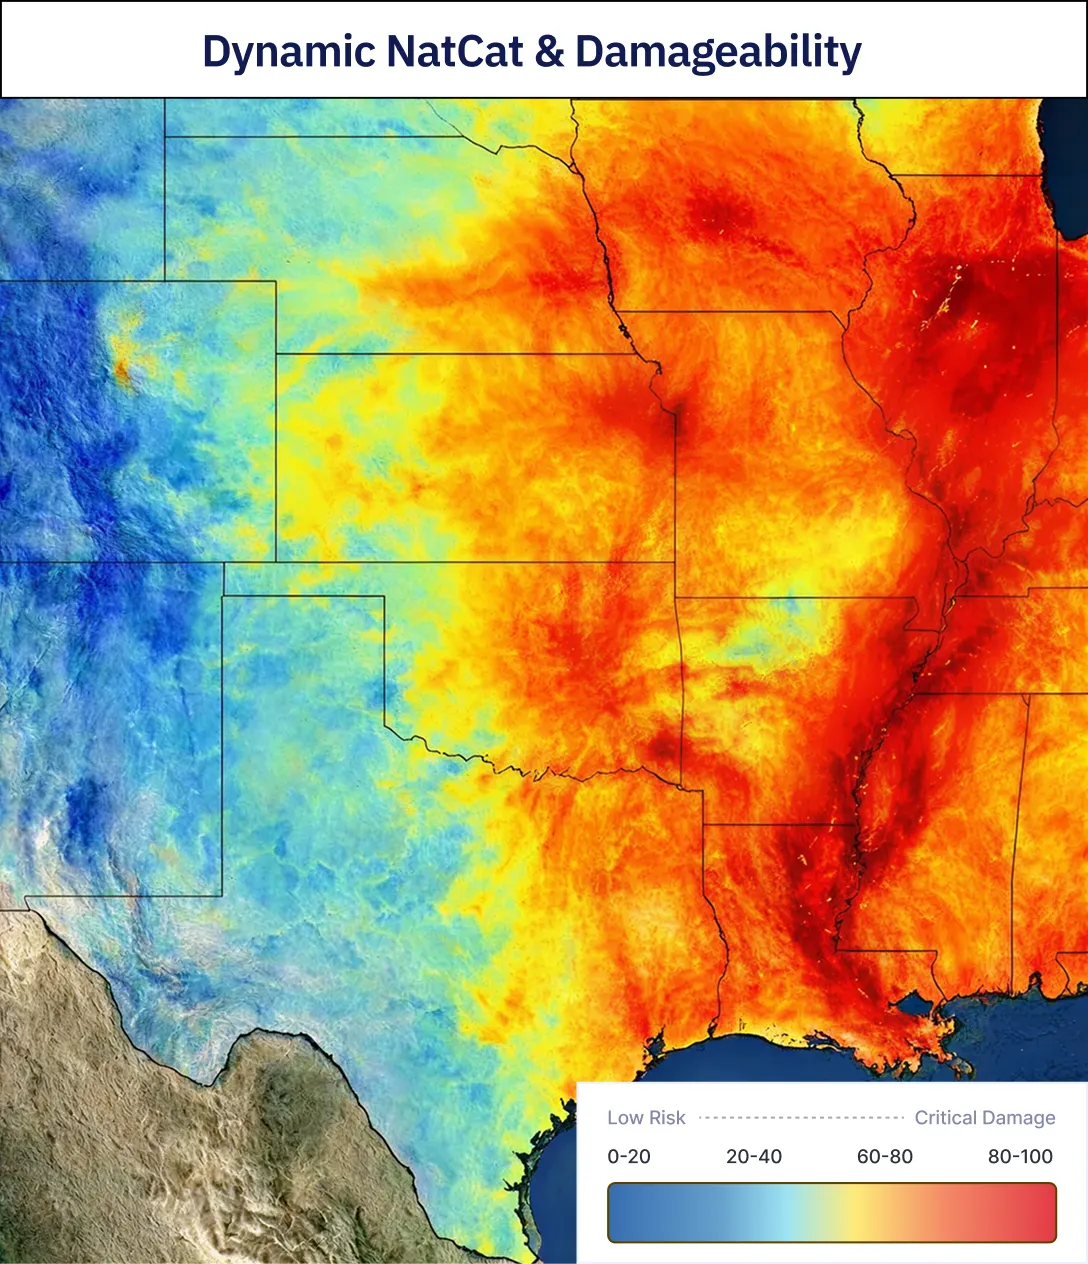
Natural Catastrophes
Quantifies exposure across 12 perils from seismic activity to wildfire to storm surge with high resolution mapping. Price or plan accurately.
Multi-Peril Risk Scores
Location-specific probability and severity ratings for earthquake, hurricane, tornado, hail, flood, wildfire, etc.
Design Recommendations
Design recommendations through assessment of peak seismic exposure estimates, fault proximity, and liquefaction susceptibility.
Distinguish Dealbreakers
Flood, flash and storm surge depths mapped against FEMA zones, elevation, and drainage capacity.
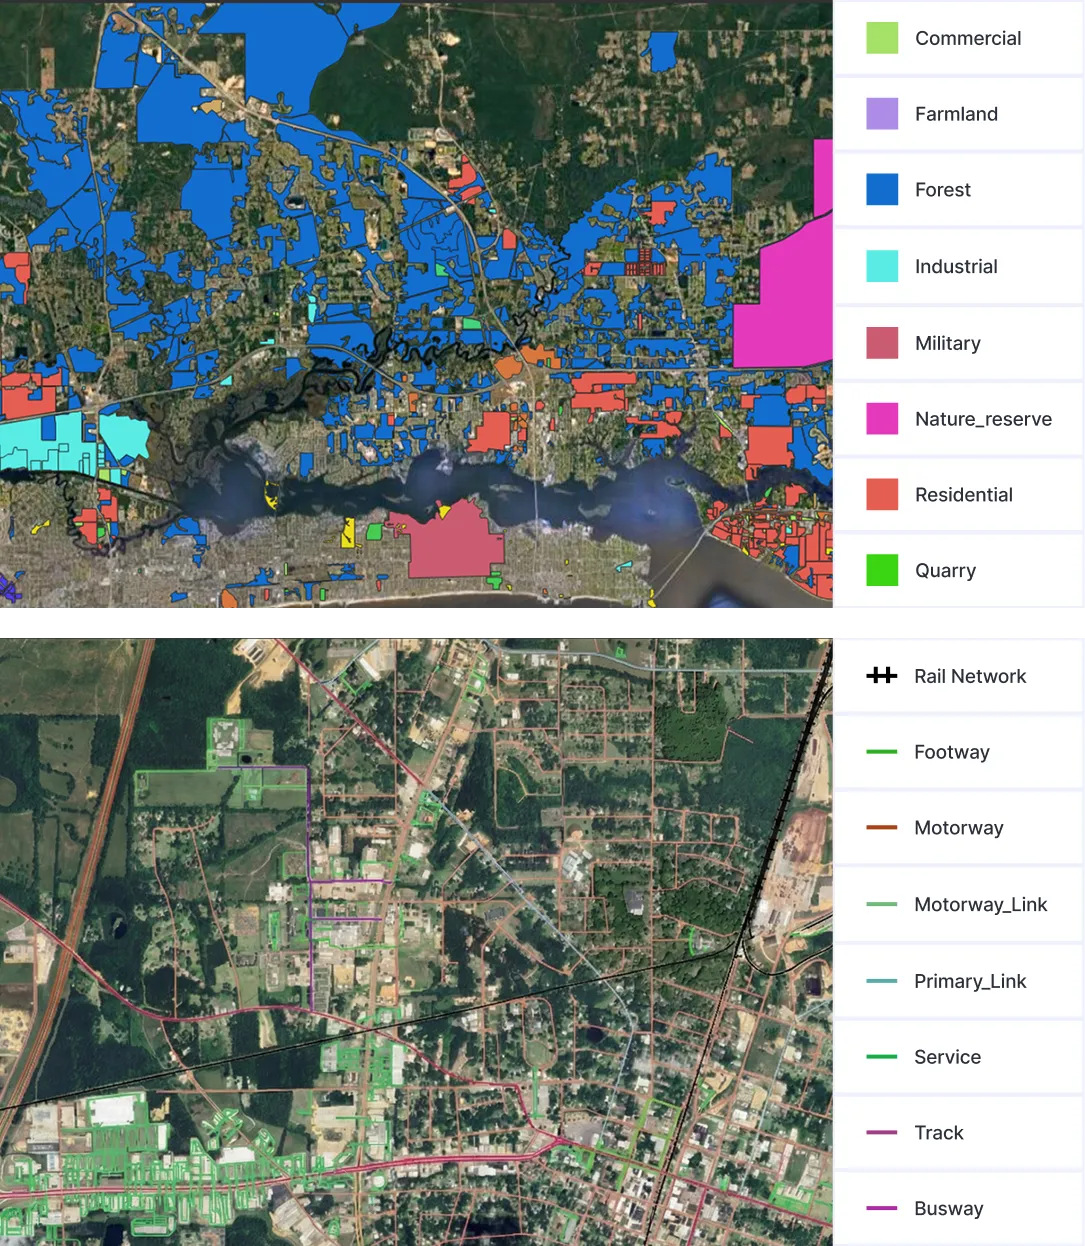
Adjacent Exposure
Reveals how surrounding infrastructure, utilities, water systems, and land-use constraints influence site risk, constructibility, insurability, and long-term operational exposure.
Built Infrastructure
Proximity to roads, buildings, and transport corridors indicating access quality, third-party risk, and exposure to operational impacts
Utilities & Critical Networks
Proximity of power, gas, telecom, and water networks affecting construction, service continuity, and business interruption risk
Hydrology & Land-use constraints
Nearby water bodies, wetlands, environmental compliance, and permitting complexity
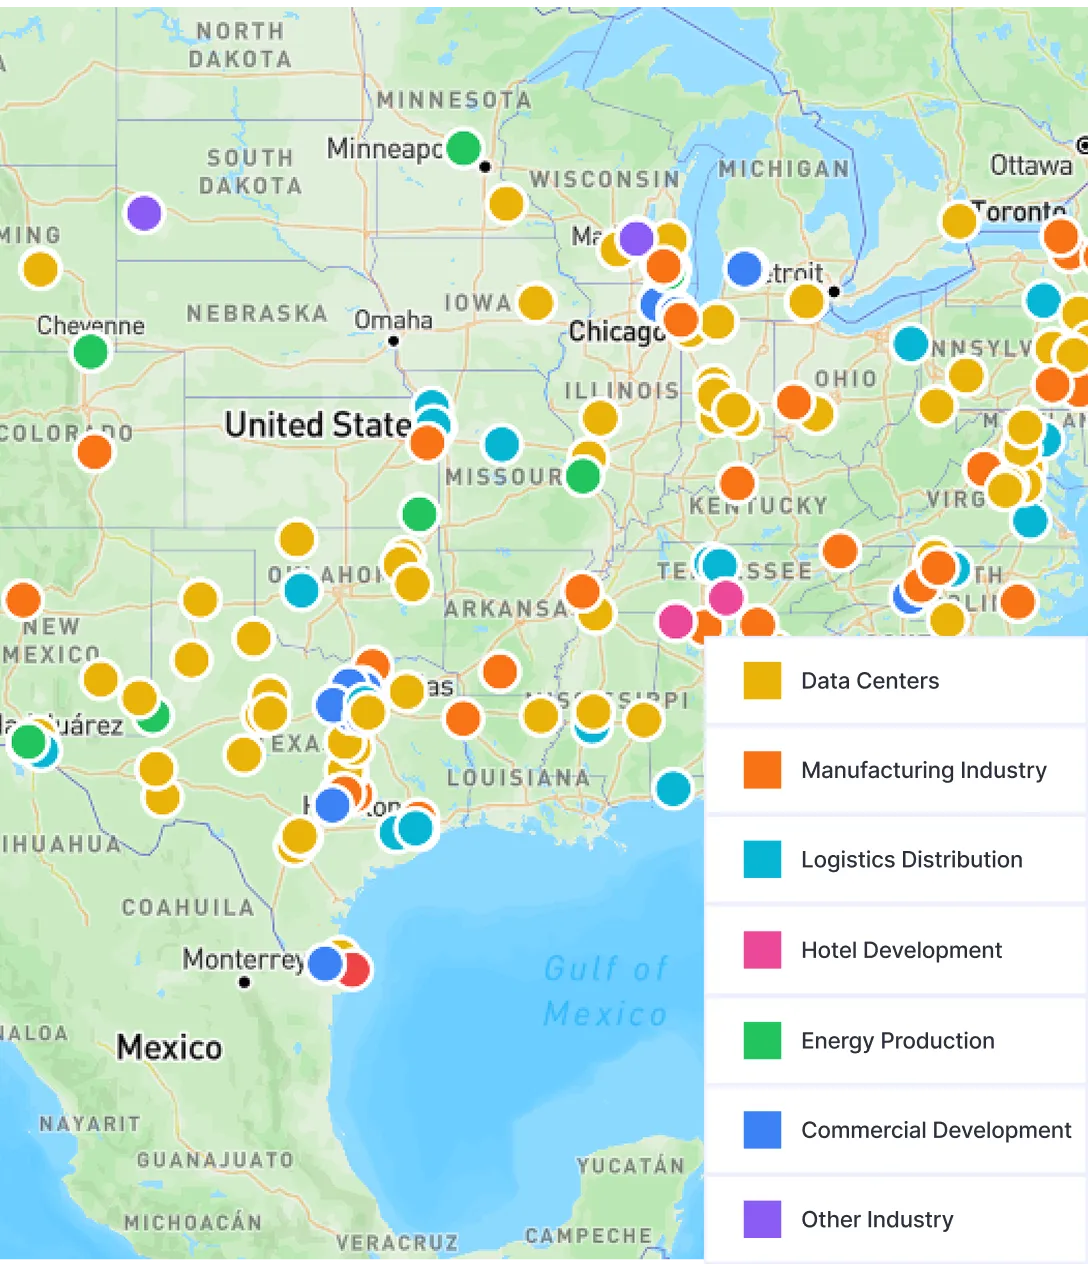
Development & Demand
Forward-looking signals on regional development, population, and energy demand that contextualize infrastructure stress and future exposure.
Planned and active developments
Nearby industrial, commercial, and data-center projects shaping future congestion and third-party exposure.
Housing Growth Signals
Forecasted demographic trends to reveal demand pressure and asset utilization risk
Grid Stress Indicators
Projected power consumption and generation patterns to highlight resilience concerns and insurability implications.
Speak With Our Team


.webp)
.png)


.svg)
Subscribe To Our Newsletter
.webp)