
Scale the Speed.
Keep the Standards.
while preserving the thoroughness and traceability that reinsurers demand.
Agentic AI at the Core
Every feature in TRAIL is powered by intelligent agents quietly working behind the scenes. Whether processing multimodal data sources, writing analysis documents, or generating reports
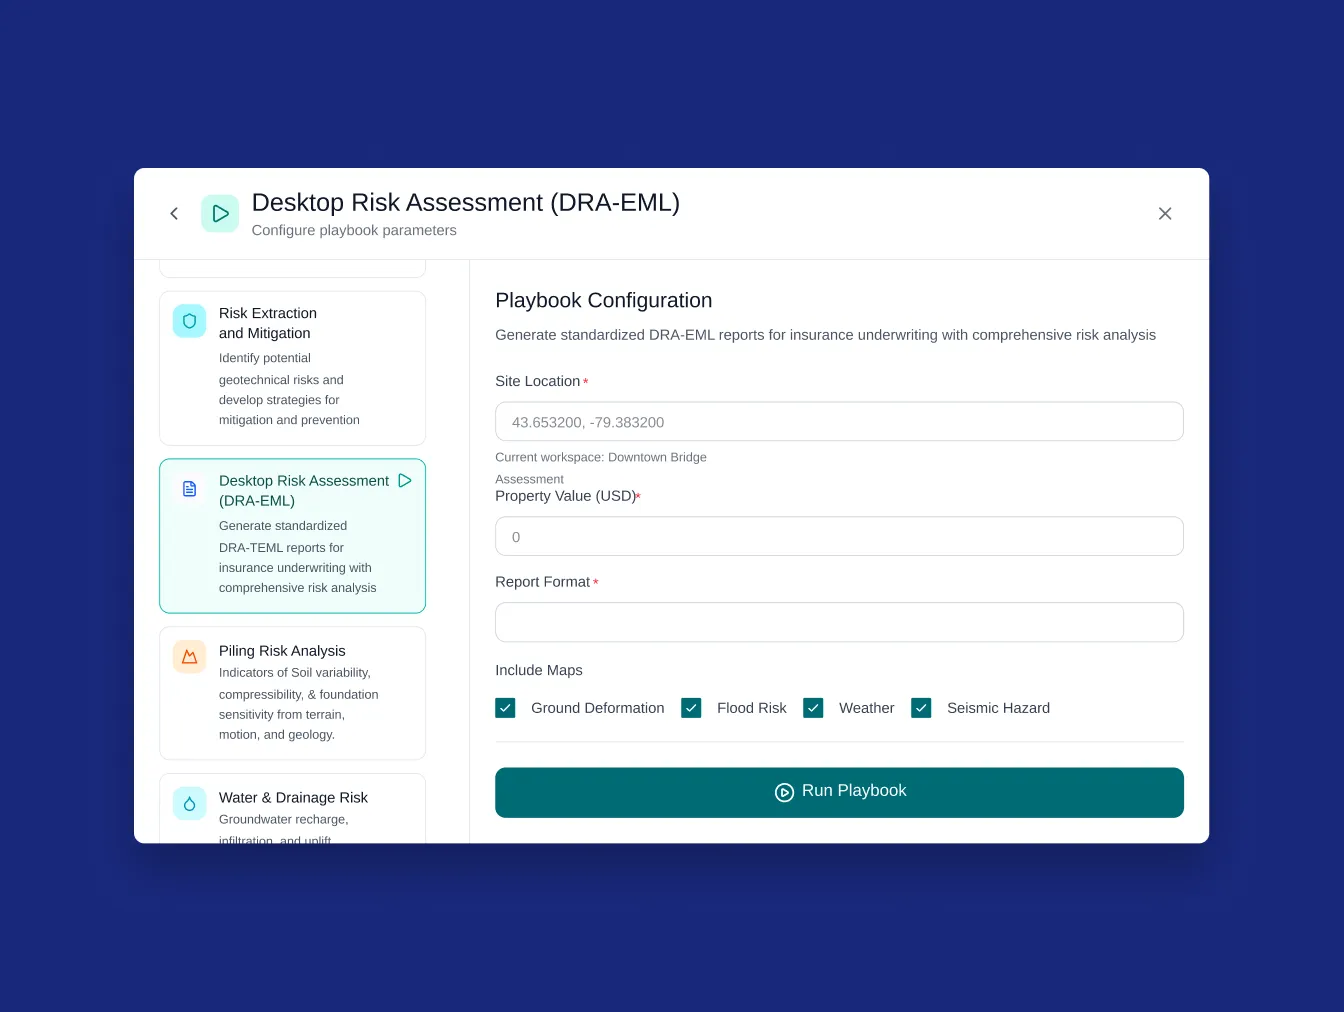
Playbooks
Run Automated Analysis Workflows
Playbooks are automated workflows that assemble evidence, follow configured checklists and guidelines to run analyses and generate audit-ready Outputs.
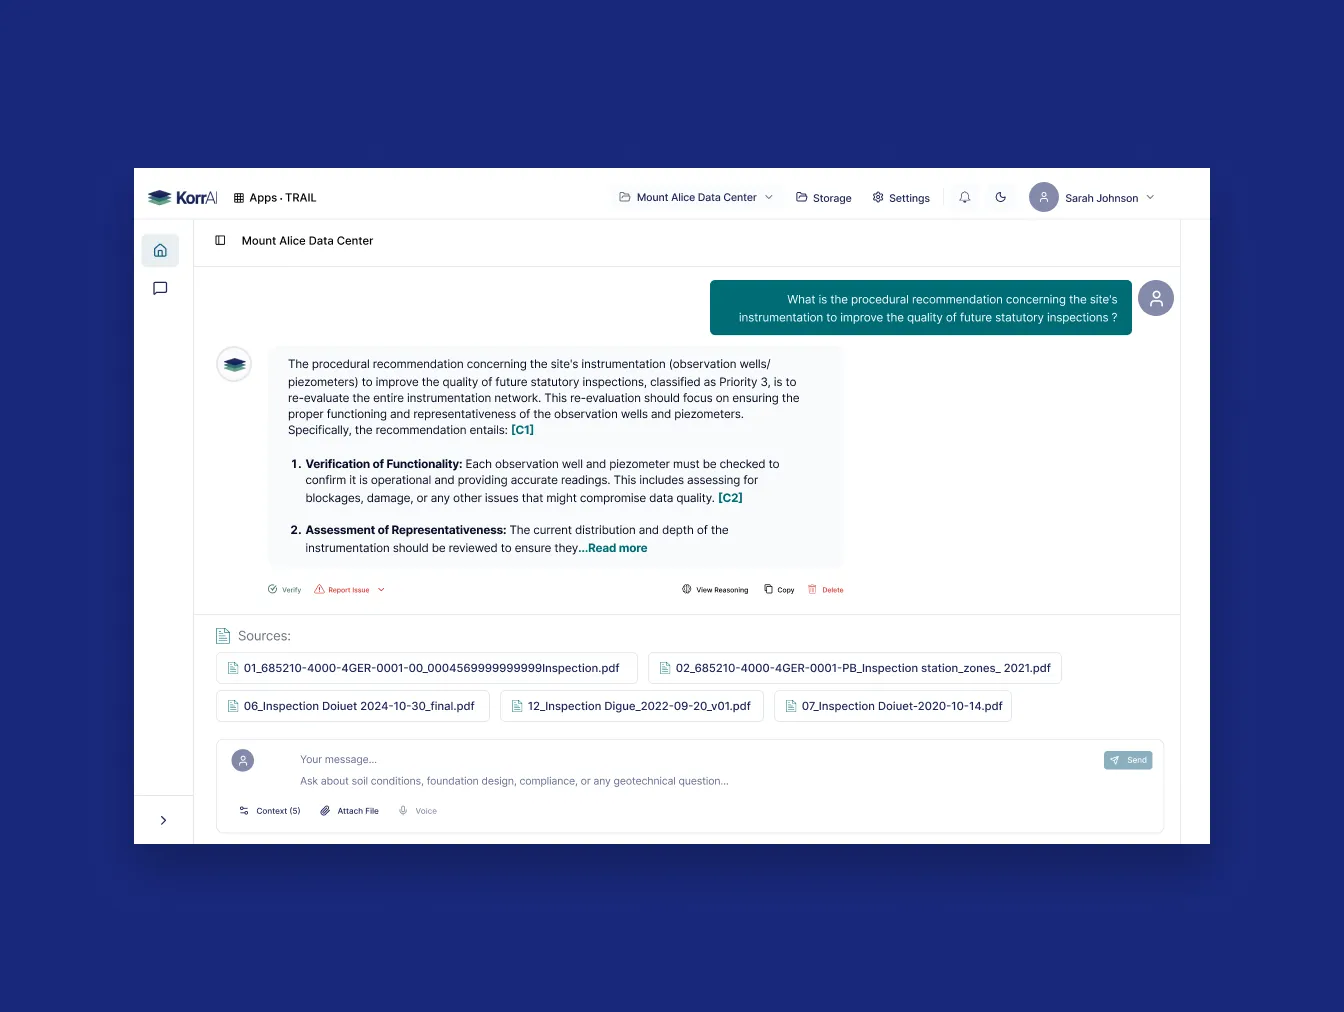
Document Intelligence
Pull Risk Signals, Flag Errors
TRAIL reads uploaded PDF, PPTX, CSV files to create a queryable knowledge graph. It flags missing reports and extracts information as per user questions or playbook instructions.
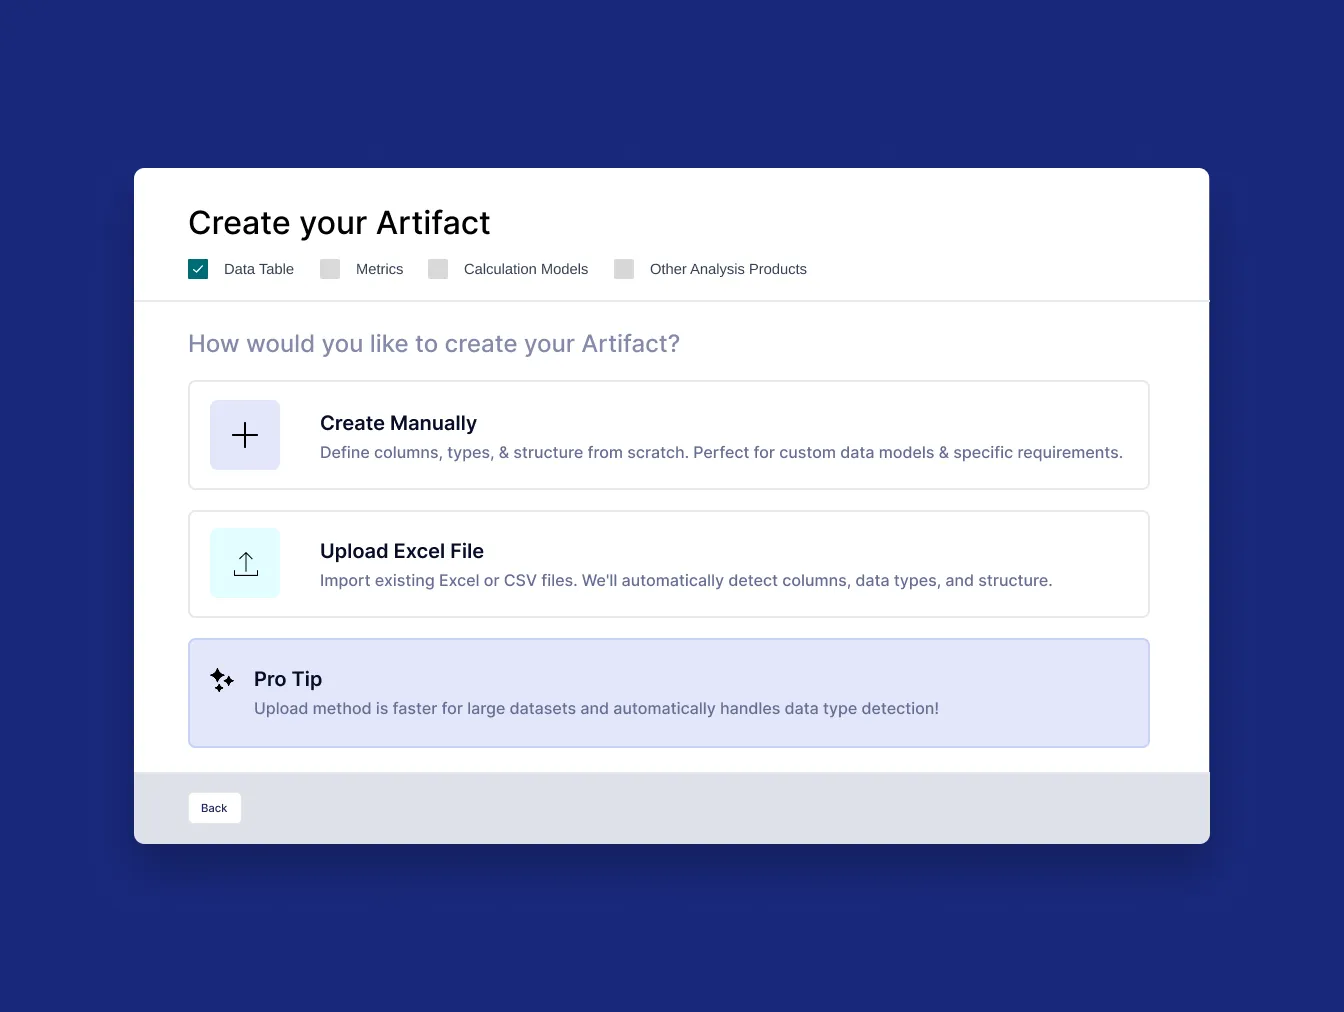
Artifacts
Build Once, Reuse Everywhere
Artifacts are the valuable analysis products that can be reused across the project lifecycle by AI agents or engineers. It speeds up a similar assessment in future.
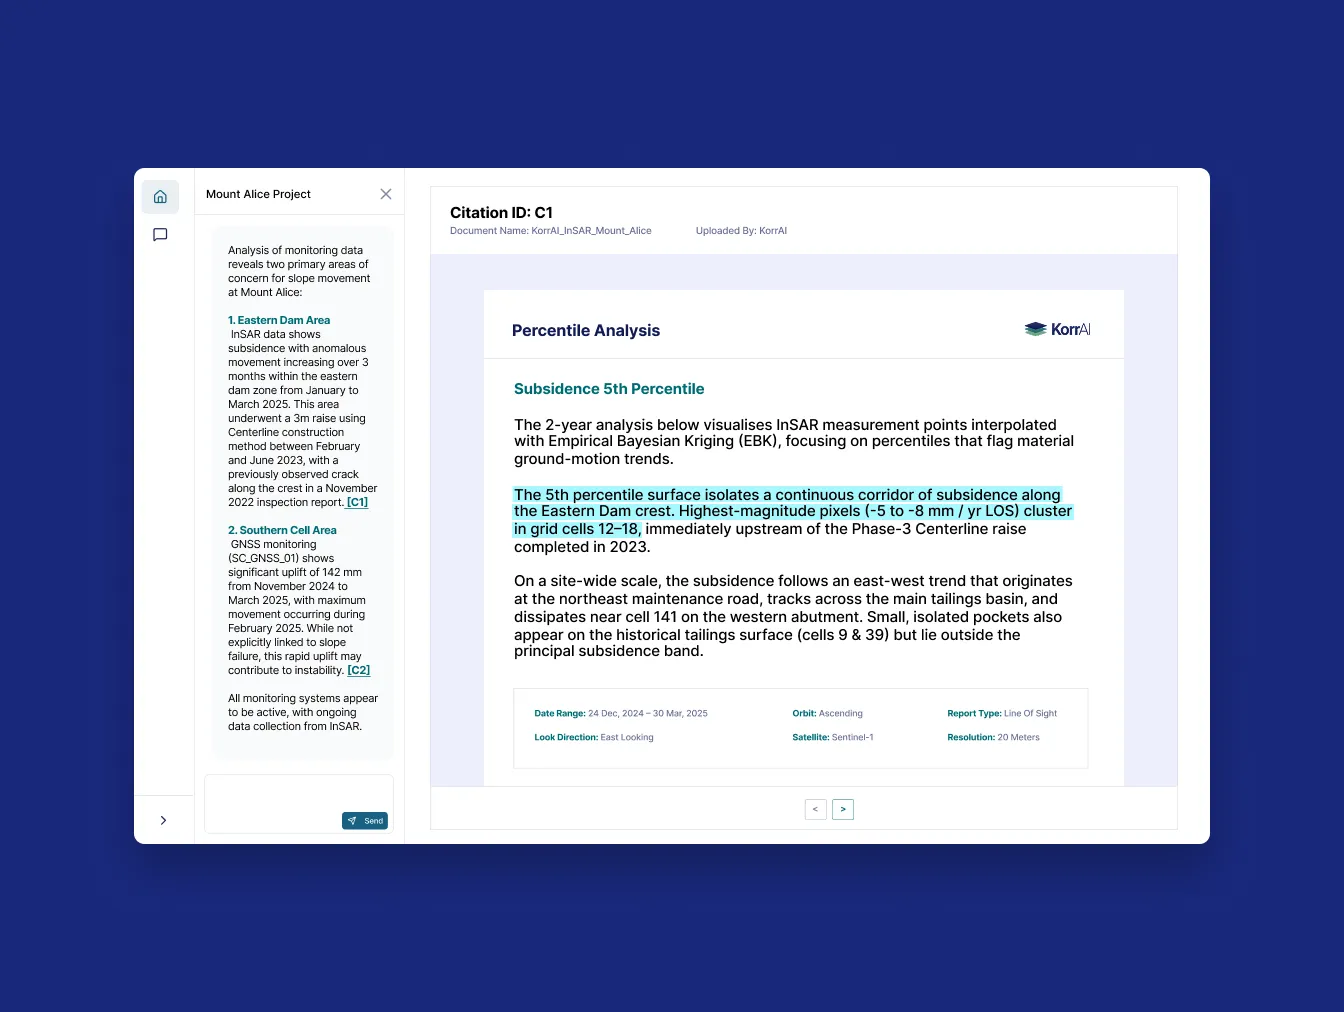
Citations
Trace Every Source
Every response links back to supporting evidence: document page, data point, model output, etc, showing exactly what report, which trend, or classification informed a statement.
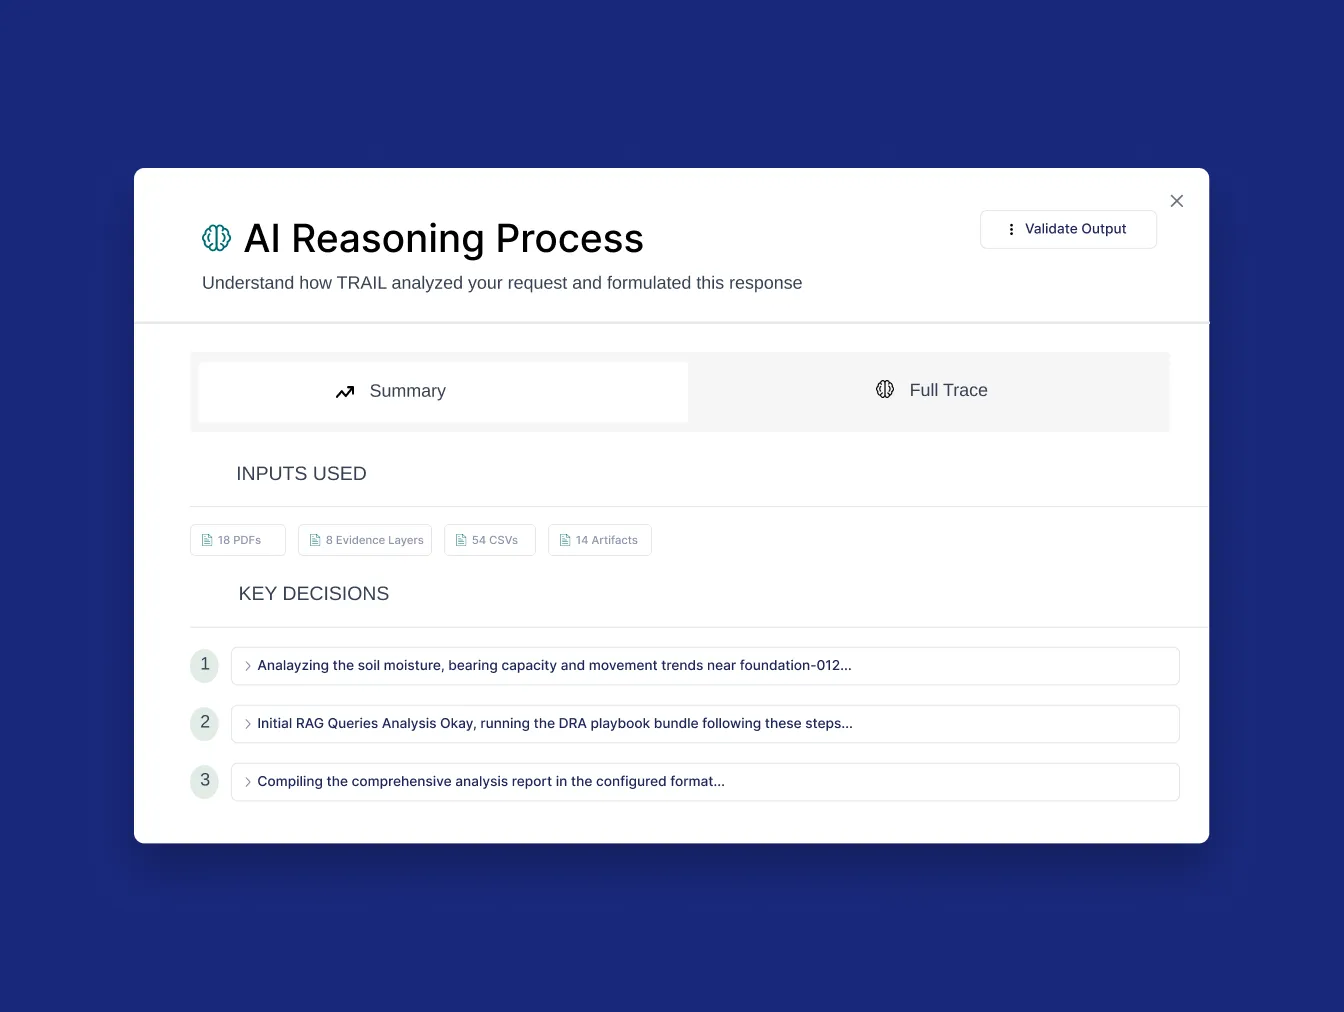
AI Reasoning
See the chain of decisions
Review TRAIL's reasoning chain: the risk layers it considered, weightage of factors, and how it reached a conclusion.
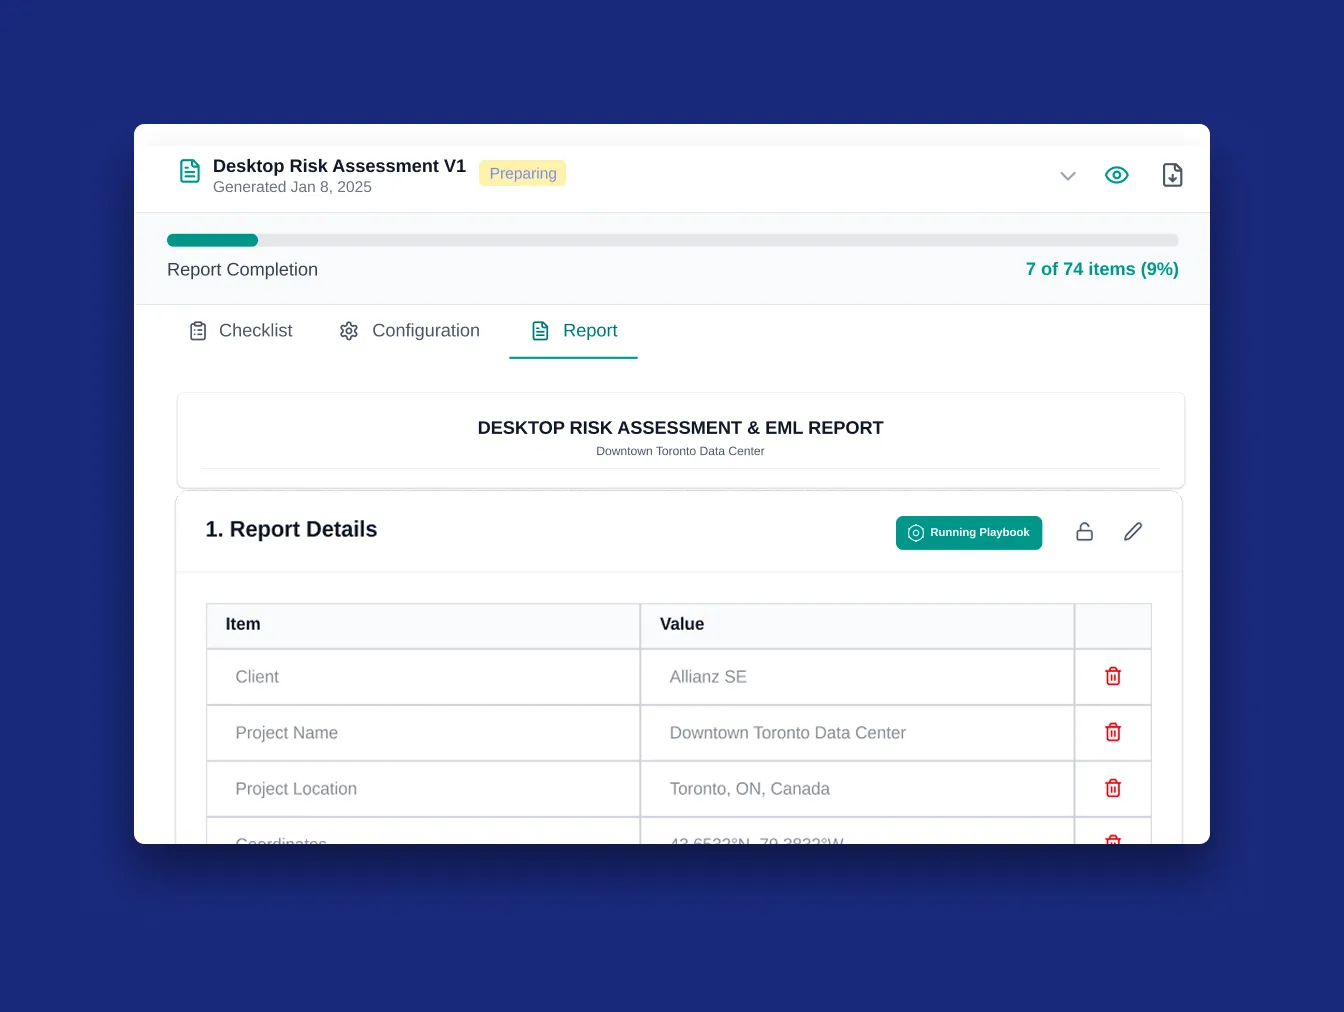
Easy Reporting
Generate & Edit Reports
Generate desktop study reports, EMLs (Estimated Maximum Loss), and other standardized formats. Review and edit, or export in multiple formats.
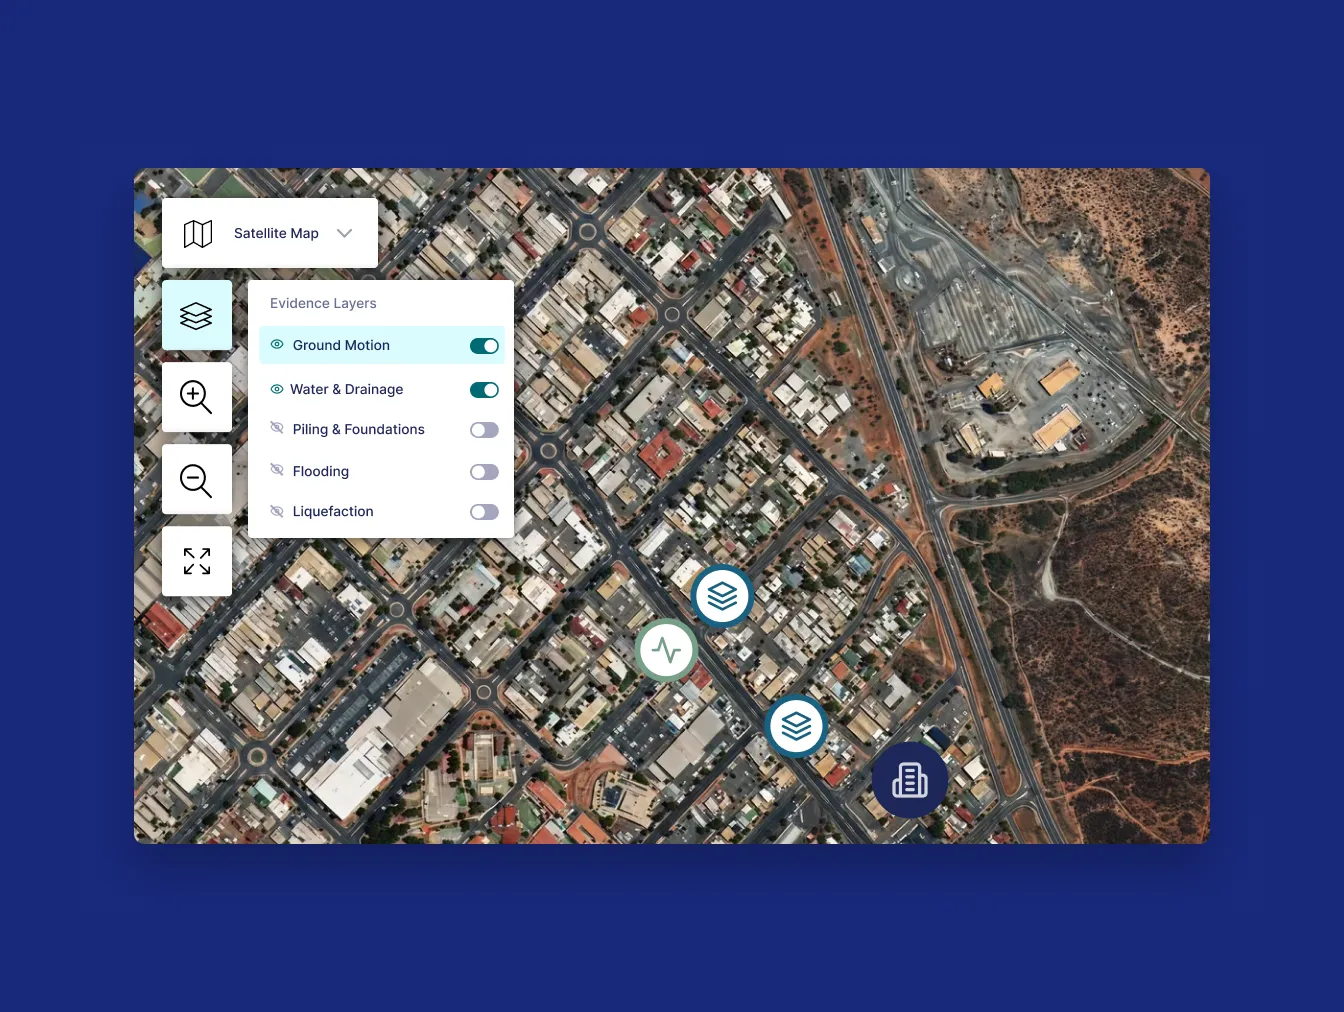
Maps with Layers
Interactive Maps & Zonal Risks
Any geospatial data: Ground Deformation, Flood zones, soil types, Instrumentation can be overlaid on interactive maps showing concentration of risks across the site.
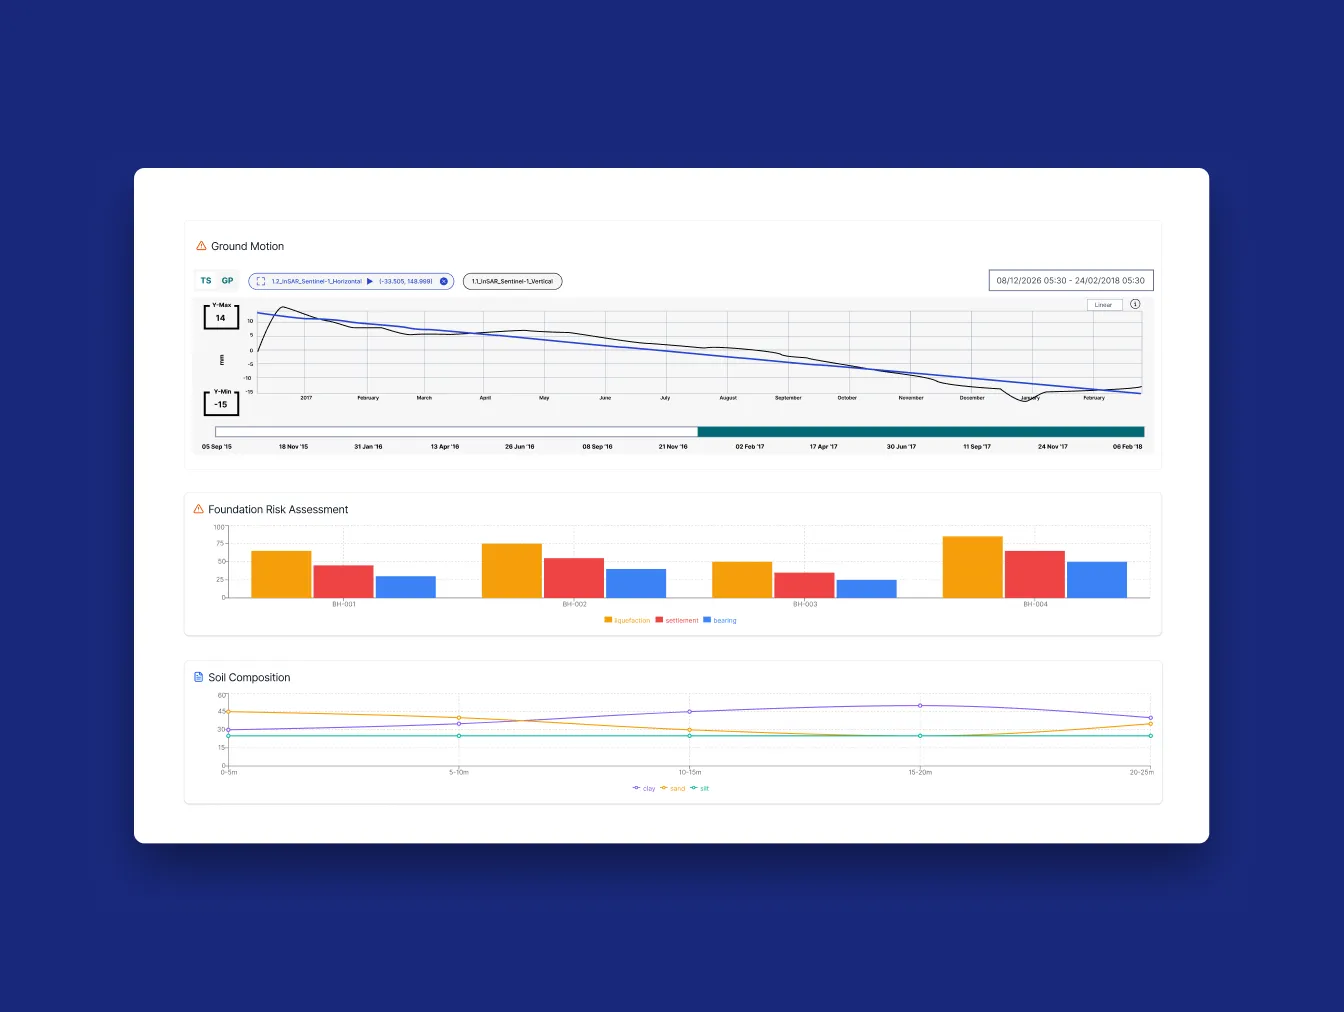
Data Visualizations
Graphs, Charts & Heatmaps
Trends like deformation over time, bearing capacity, or weather information are visualized with graphs and charts to make patterns instantly clear.
Speak With Our Team


.webp)
.png)


.svg)
Subscribe To Our Newsletter
.webp)