
Table of contents
Introduction
"Over the last 30+ years, I’ve worked on SAR interferometry for infrastructure and geohazard projects and related research. This introductory article was written keeping in mind the knowledge gaps, practical challenges, and the concepts that drive professional decisions when using satellite-based InSAR.''
- Prof Dr Vern Singhroy, Technical Advisor, KorrAI, Chief Scientist, RADARSAT Constellation Mission
The foundations crack. Pipelines warp. Dams fail. And often, the earliest warning signs are beneath the surface.
The ground we stand on is becoming unstable. Subsidence, the vertical sinking of land, is a global problem that causes billions of dollars in damage annually to physical infrastructure and loss of life. Groundwater extraction and urbanization are the leading causes, accounting for 40% of ground subsidence incidents. With climate change compounding the issue, the next few decades will challenge the foundations of our economic system.
Traditional monitoring tools like Piezometers, inclinometers, and ground sensors are precise, but only where they're placed. These point-based systems often miss the early signs of instability happening just meters away. The result? Disconnected data, reactive decisions, and missed opportunities to prevent failure.
But today, we have the solution to see the whole picture.
InSAR We Trust
Interferometric Synthetic Aperture Radar, commonly known as InSAR, enables ground motion monitoring with millimeter-level precision over entire cities, mines, and infrastructure corridors, without the need to set foot on site.
InSAR has been around for at least two decades, but the lack of high-quality data, computational complexity, and prohibitive cost kept it from becoming widely adopted. That’s changing with a growing number of radar satellites, affordable computing, and efficient algorithms.
In the slow-moving landscape of ground motion monitoring…..InSAR we trust.
If that awkward joke landed, we’re off to a great start. Let’s unpack how InSAR actually works and why it’s gaining momentum.
What is InSAR?
Interferometric Synthetic Aperture Radar (InSAR) is a remote sensing technique for monitoring millimeter-level displacement of the Earth’s surface through repeated radar imaging of an area over time.
Data is typically obtained from satellites carrying Synthetic Aperture Radar (SAR) sensors that transmit microwave spectrum signals. These radar waves penetrate through cloud cover and also operate in darkness, making them suitable for tracking deformation irrespective of the weather conditions.
How InSAR Works
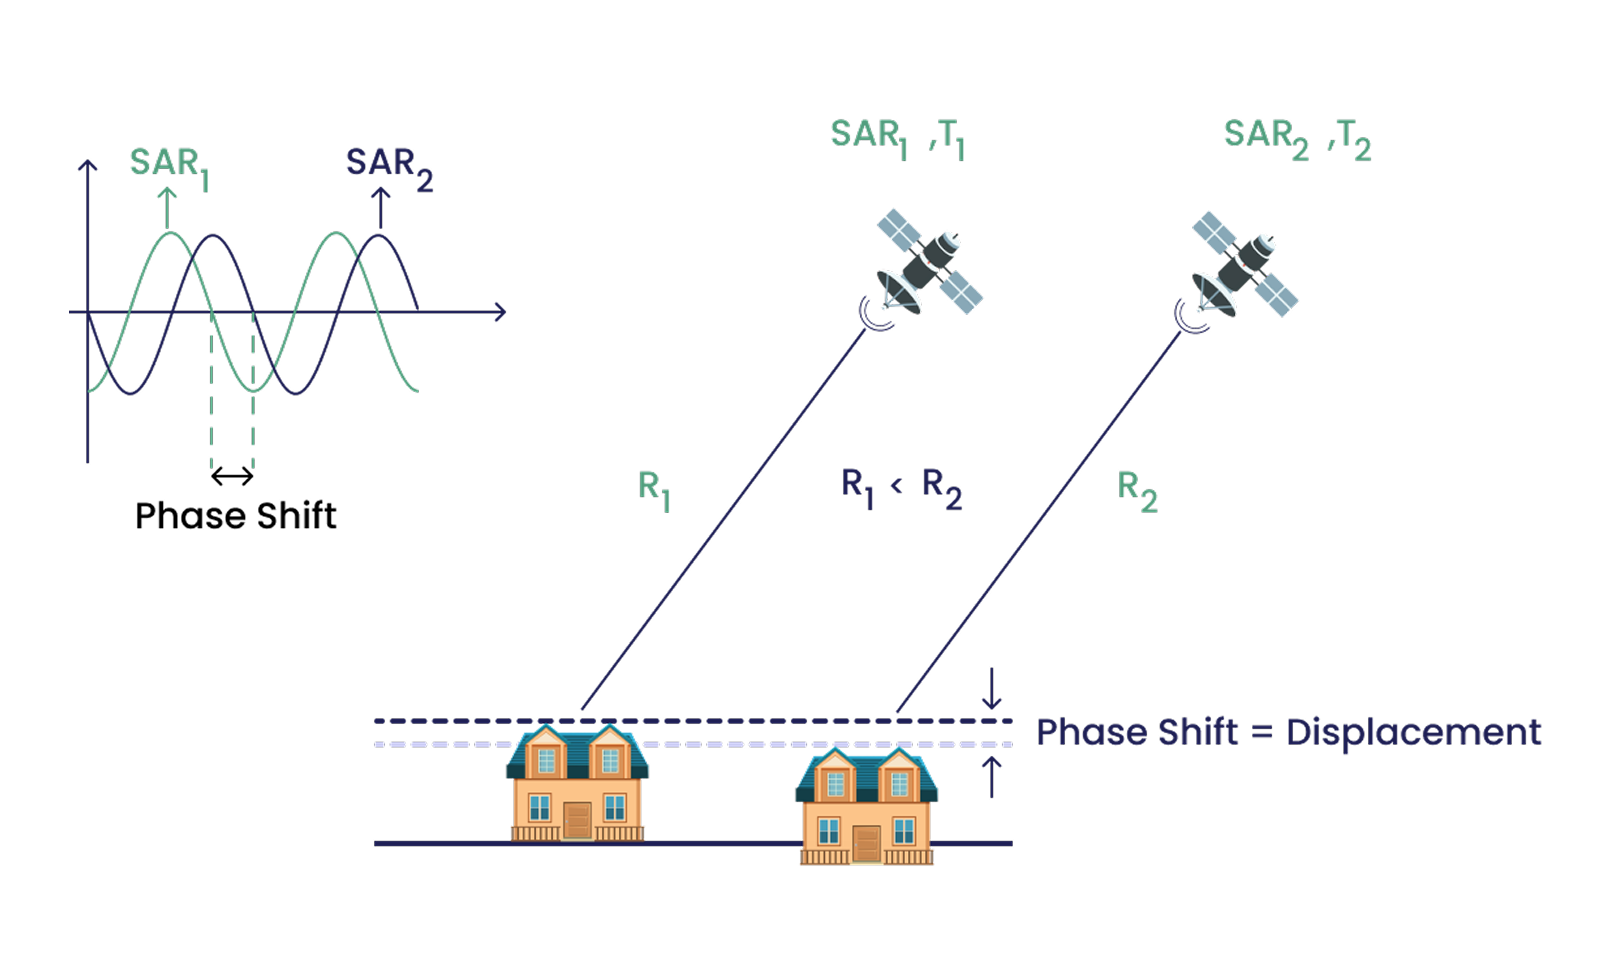
Synthetic Aperture Radar (SAR) satellites transmit microwave signals that are then scattered and reflected by the Earth's surface. When the backscattered radiation is received back at the sensor, its amplitude and phase are recorded.
InSAR works by measuring the phase difference between two radar images over the same area, captured from similar vantage points in space at different times. Any movement in the ground that might have occurred between the two images can be measured and visualized as a deformation map.
The processed set of images highlighting the phase differences is called an interferogram. These differences appear as patterns or colorful fringes that represent how much the ground has shifted. Interferograms are the core product used to detect and measure ground deformation with millimeter-level precision.
How are Interferograms generated?
Think of interferograms as a third image created when two radar images (of the Earth) are superimposed. Here's a simplified explanation of how interferograms are created:
- Satellite Acquisition: A satellite captures radar images of a specific area at different times (days, weeks, or months apart). Each pixel in a radar image, also called a SAR image, stores two components:
- Amplitude (brightness)
- Phase, which relates to the distance between the satellite and the ground surface
- Phase Comparison: Purpose-built algorithms compare these images by analyzing the phase difference, which refers to the slight shifts in radar wave patterns between them.
- Generating an Interferogram: These phase differences are visualized in an interferogram, where patterns of fringes represent phase shifts and any movements. Each fringe typically represents a set amount of surface displacement. This amount depends on the radar wavelength. One fringe typically represents half the sensor’s wavelength (λ/2) in line-of-sight displacement. For example, X-band sensors show about 1.5 cm of movement per fringe, while RADARSAT-2 (C-band) corresponds to roughly 2.8 cm.
Phase Unwrapping
When radar measures phase, it’s inherently bounded between 0° and 360° (or 0 to 2π radians). This means that once displacement exceeds half the radar’s wavelength (λ/2), the phase "wraps around," showing the same fringe color again. As a result, interferograms appear as repeating bands, but these do not reveal how much total displacement has occurred.
Phase unwrapping is the process of reconstructing the true, continuous displacement from these wrapped values. It works by integrating the measured phase differences across an image to recover the actual ground movement, including full cycles that have occurred between radar passes.
For instance, if a tailings dam settles by 6 cm between observations and the sensor wavelength is 5.6 cm (C-band), phase unwrapping allows the algorithm to recognize this as more than one cycle (1 full + a fraction). Without unwrapping, this could be misread as just a small shift within a single fringe. Phase unwrapping corrects this and ensures accurate interpretation.
The process also filters out unwanted contributions from topography, atmospheric delays, and noise, especially in areas with low coherence (e.g., vegetated or water-covered surfaces).
Take a look at Figure 2.
.png)
The second image in the figure is an unwrapped interferogram, a visual representation of the phase difference between two radar images acquired over Mt. Etna before and after an eruption in 2018. Once the phase difference is unwrapped, we arrive at the third image, which translates the interferogram into a clear deformation map with unwrapped displacement values in mm/year.
Time-Series InSAR: More Than Just Two Images
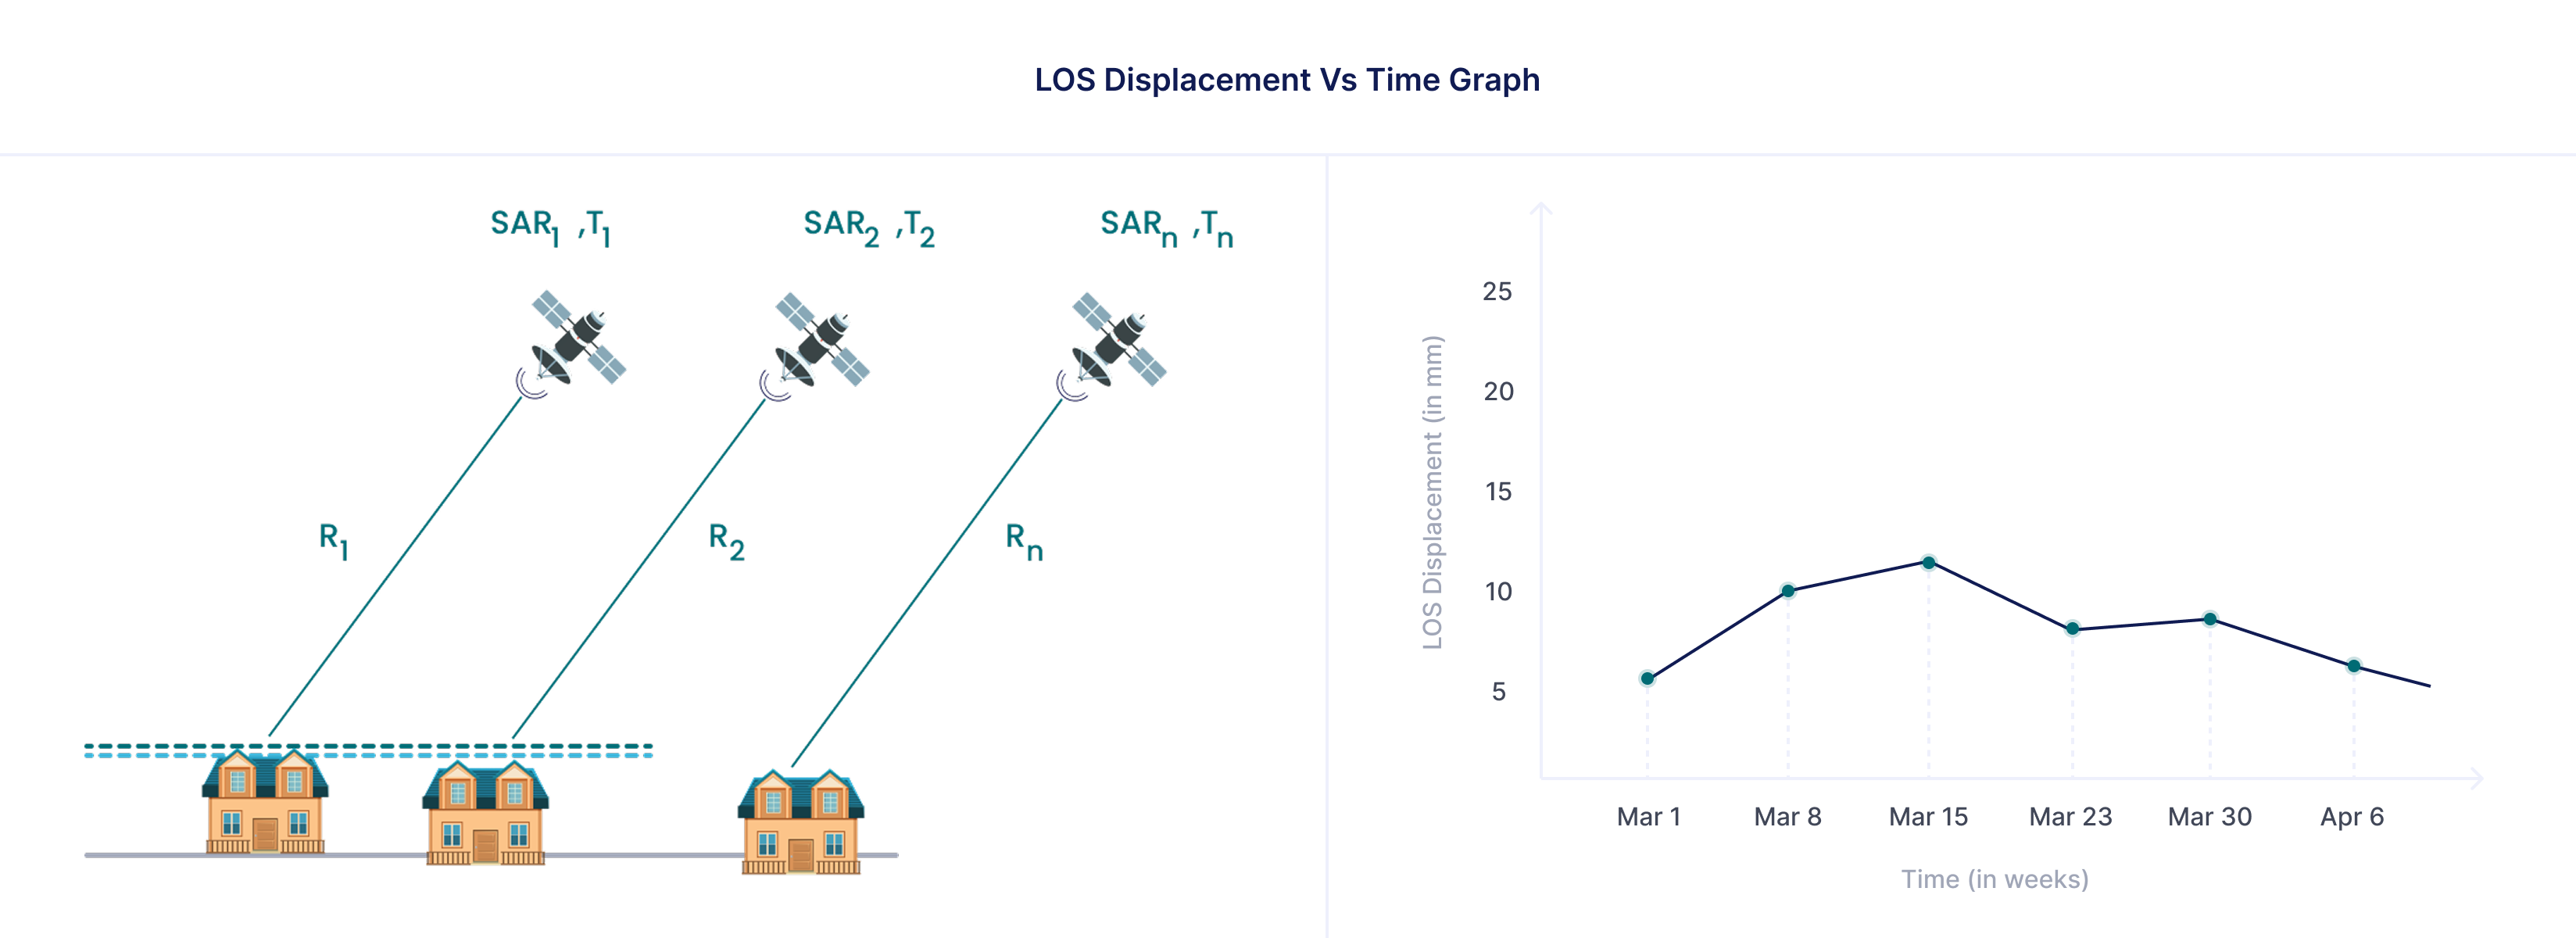
While two images can produce a single interferogram, they capture just one moment of change. Modern InSAR analysis depends on many more. A stack of 15 or more images, taken over weeks or months, enables long-term monitoring. For example, land sinking from groundwater extraction, slope shifts in mines, or gradual settling under urban infrastructure.
Repeated imaging makes InSAR much more effective at recording a continuous timeline of ground movements: you don’t just know that movement happened, but how fast, when, and in which direction. Thus, it enables the stakeholders of critical infrastructure to monitor instability or emerging hazards and respond proactively rather than reactively.
I’ve always likened it to taking a selfie every day and then creating a time-lapse from them. While Picture 1 and Picture 2 might not reveal much, by Picture 200, you’ll know if you’ve been using enough sunscreen while out in the field.
But to make sense of what InSAR is telling us, it’s essential to understand how the satellite sees the Earth and what direction it’s measuring in.
That brings us to a foundational concept: Line-of-Sight (LOS).
Line-of-Sight (LOS): The Direction InSAR sees
InSAR doesn’t measure ground displacement the way we might with a traditional instrument on site. It doesn’t directly say, “the ground dropped 3 cm vertically.” Instead, it captures changes along the radar’s line of sight (LOS), the angled path from the satellite to the ground.
You can think of LOS like a laser pointer coming down at an angle from the satellite. If the ground moves directly along that line, toward or away from the satellite, InSAR captures the full displacement. But if the movement is perpendicular to that beam, InSAR sees only a fraction of it or sometimes, nothing at all.
That brings us two news, one good and one bad.
Bad news: The measurement is one-dimensional. In one satellite pass, only the component of displacement aligned with the radar’s look direction is captured.
Good news: Displacement can be measured down to millimeter-per-year accuracy.
Now, imagine a road embankment that’s slowly sliding downslope, mostly sideways. If that motion lines up well with the satellite’s view angle, InSAR will pick it up clearly. But if the slope slides north-south, and the satellite travels in a nearly north-south path, it will miss most of the motion.
At this point, you might wonder: if it can’t see everything, how is InSAR reliable for infrastructure risk monitoring?
That’s where multi-directional imaging comes in.
Ascending & Descending Passes: Seeing from Both Sides
To improve how we see movement, especially in complex terrain, satellites collect data from two directions:
- Ascending pass: satellite moves north, looking east.
- Descending pass: satellite moves south, looking west.
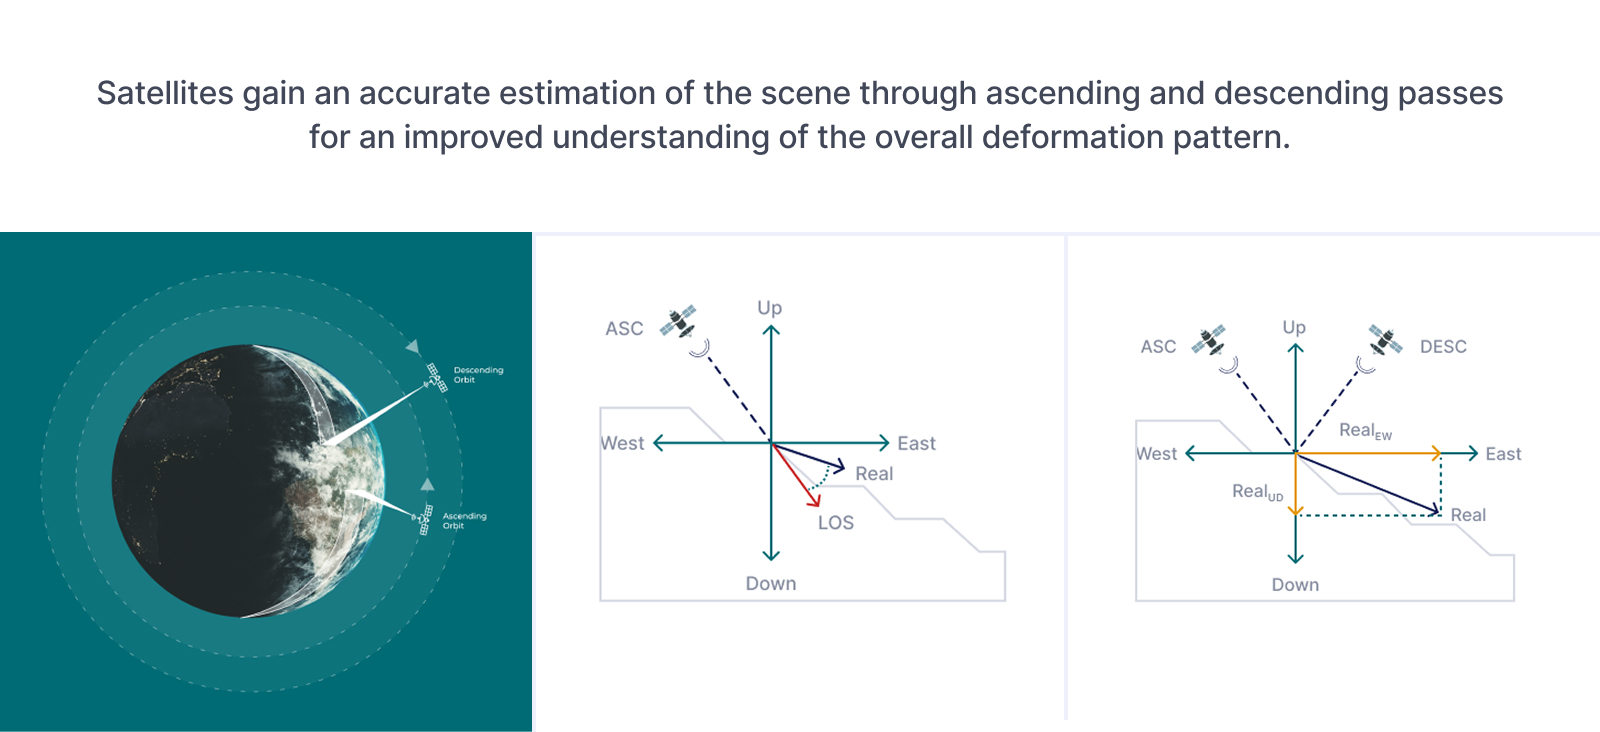
By combining these two LOS views, we can decompose ground motion into vertical and east-west components, giving us a more complete story, especially in places like mines, dams, or landslide-prone slopes, where deformation isn’t happening in just one direction.
For instance, at a tailings dam site, vertical settlement due to weight of new material and lateral spreading from slope instability often happen together. Using both ascending and descending InSAR data helps track both motion reliably, even if the motions unfold slowly.
Radar Viewing Geometry
From the way InSAR sees Earth, you might have guessed already that radar satellites are side-looking by design. They scan the ground at an angle between ~30° and 60°.
- Steeper angles (closer to vertical) are better for detecting vertical motion, like ground subsidence.
- Shallower angles (more oblique) improve sensitivity to horizontal motion, such as slope slides or spreading.
Most satellites operate around the median ( like Sentinel-1, which operates around 39°), giving a reasonable balance between vertical and horizontal sensitivity.
Common Distortions in Hilly or Urban Terrain
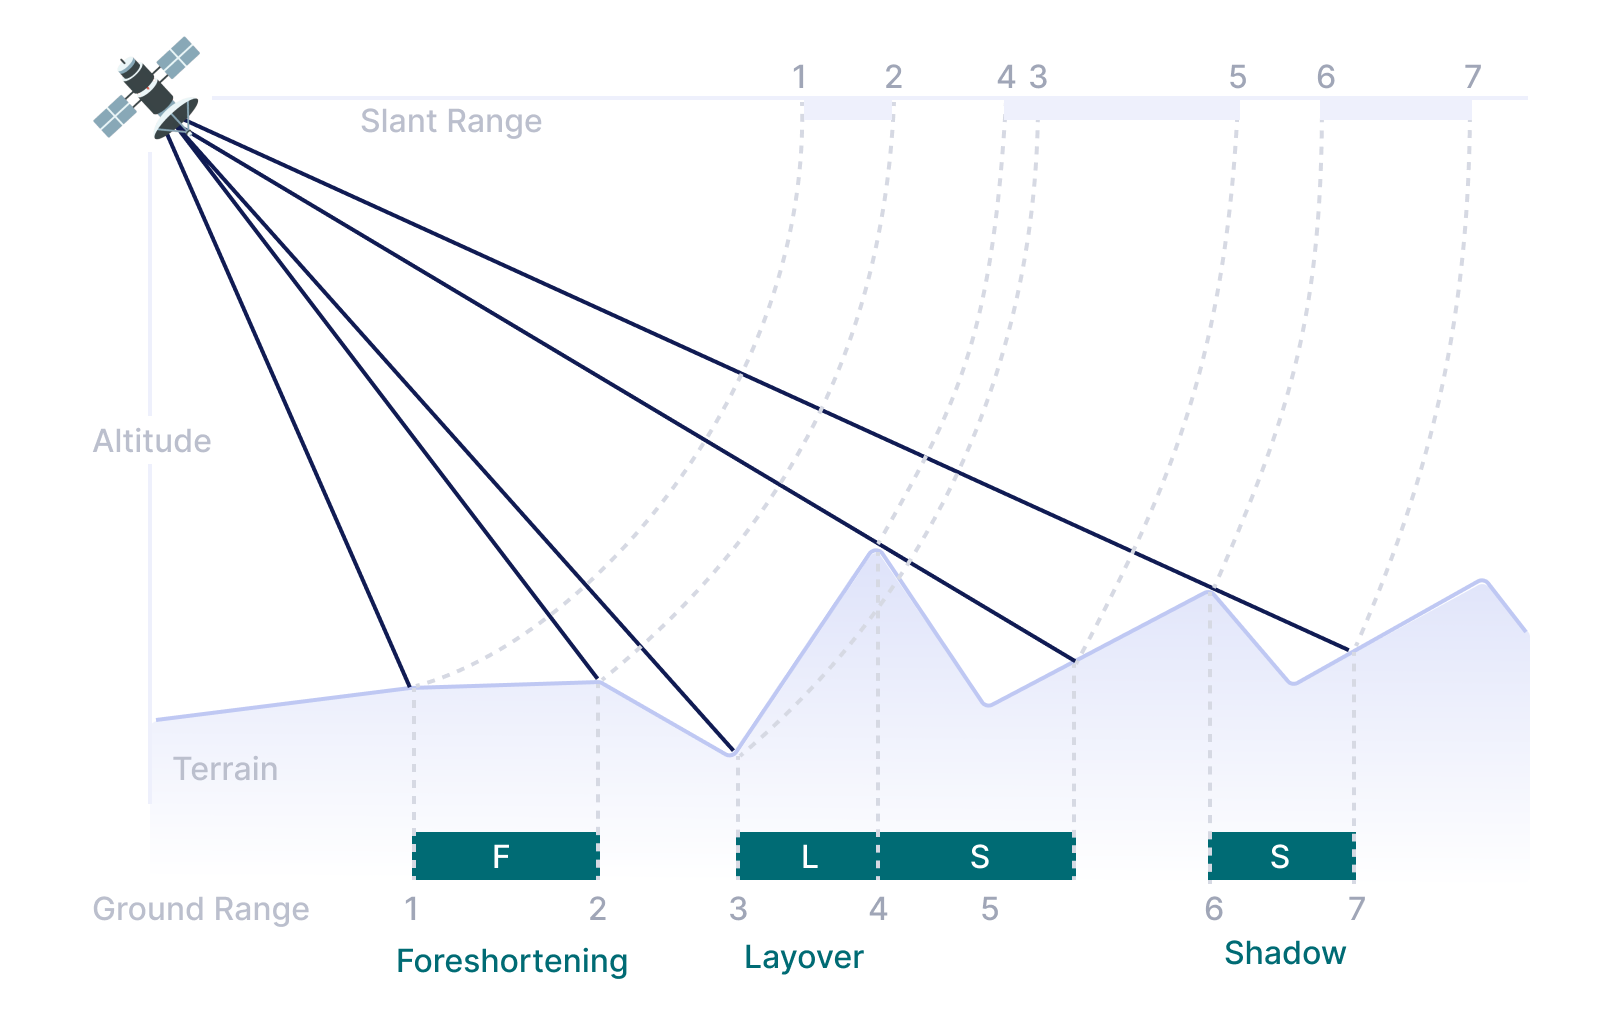
Because radar satellites view the Earth from an angle rather than straight down, topography and tall structures can distort the radar image in several predictable ways:
- Foreshortening: When a slope faces the satellite, it appears compressed in the radar image, reducing spatial resolution and measurement accuracy.
- Layover: If the top of a slope or building is closer to the satellite than its base, the radar signal arrives out of sequence, making features appear flipped or warped.
- Radar Shadow: Steep slopes that face away from the satellite may not be illuminated at all, resulting in shadowed areas where no radar signal is received, similar to sunlight casting shadows behind mountains.
These effects aren’t deal-breakers, but they do mean some areas are more difficult to monitor than others. Multi-directional passes help improve the data quality. Another typical way of addressing these distortions is Digital Elevation Models (DEMs), which help both simulate distortion zones during planning and remove topographic noise during processing. In dynamic areas, frequent DEM updates and shorter monitoring windows improve reliability.
To improve measurement accuracy in hard-to-reach areas like bridges or steep slopes, corner reflectors are used. These act as stable, artificial targets that ensure strong, consistent radar returns. At KorrAI, corner reflectors are strategically deployed to overcome distortion zones and enable precise, high-confidence monitoring even in geometrically complex terrain.
Now that we understand how viewing geometry affects radar images, the next question is: Can the radar see the same thing clearly every time it passes? That’s where two concepts become important: targets and coherence.
Coherence & Target Suitability
InSAR tracks features on the ground over time. These features are known as targets and represented as measurable pixels in InSAR analysis. Targets can be anything, from a building in an urban setting to a rock outcrop on a barren land. But not all targets are equally stable during a monitoring period.
Coherence is the metric that quantifies the quality of targets in an interferogram, representing continuity over time.
It’s radar’s way of asking: “Did I get the same signal from this spot as last time?” Coherence is measured on a scale from 0 to 1; a lower value means too much change, and a higher value depicts a persistent target.
Roads, buildings, and bedrock tend to stay coherent. Water, snow, vegetation, and construction zones do not. Hence, there are several types of targets:
- Permanent targets or Persistent Scatterers (PS): infrastructure, exposed rock, or compacted soil maintain a consistent radar signature over months or years. These are ideal for long-term monitoring.
- Temporary targets, such as tailings dams or seasonal roads, may be stable only during part of the monitoring period, for instance, due to snow cover.
- Distributed targets: bare soil, gravel surfaces, or landfills that lack a single dominant radar reflector. They can still be tracked, but usually require more advanced processing like SBAS (Small Baseline Subset) methods.
- Point targets, like steel trusses or building edges, offer highly coherent returns with low phase noise.
- Non-Trackable Areas that change significantly between image acquisitions, such as water, snow, leaves, and crops.
Wrapping Up the Foundations
By now, we've demystified the core concepts behind InSAR. We've explored the importance of viewing geometry, how distortions occur, and what makes certain ground features ideal for reliable tracking.
Thanks to advanced processing techniques and smart enhancements like corner reflectors, even challenging environments like hilly terrain, urban infrastructure, or vegetated zones can now be monitored with precision and confidence.
In short, InSAR has matured from a scientific curiosity into a practical, deployable tool for understanding how the ground moves before it becomes a billion-dollar problem missed by traditional tools. At KorrAI, we’ve done exactly that for major global partners like AWS, Zurich, Eldorado Gold, Stantec and others to monitor over $ 100 Bn in assets across the globe. We combine data from satellites, ground sensors, reports, surveys, etc. to deliver high-accuracy intelligence without the need for frequent site visits. Want to understand how we can help in your project? Book a meeting with our experts today.
Cheers! You’re now fluent in the fundamentals: interferograms, phase unwrapping, radar viewing angles, distortion types, and target coherence.
But knowing how the tech works is just the start.
In the next part, we’ll take these foundations and build on them: which InSAR data to use, how InSAR is applied across industries, and what you should look for when choosing a ground motion monitoring product.
"As someone who's seen InSAR evolve over decades, it's encouraging to see the state of the art continue to advance, and not just in analysis, but in the full end-to-end application pipeline. For practitioners, this has become a critical tool today, one worth understanding and mastering.”
-Prof Dr Vern Singhroy
→ Continue to part 2: InSAR in Practice: Choosing the Right Method and Data
Share this post
Written By


Prof Dr Vern Singhroy P. Eng
Technical Advisor, KorrAI
Formerly Chief Scientist for the Canadian Space Agency’s RADARSAT Constellation Mission (2019), Prof Vernon has authored over 300 scientific publications in remote sensing. He is globally recognized for his expertise in Synthetic Aperture Radar (SAR) and remote sensing, with his contributions spanning more than 35 countries. At KorrAI, he advises on the development of our InSAR products for ground motion monitoring.

Simon Irving
Delivery Manager, KorrAI
Simon holds a BSc in Earth Sciences from Dalhousie University and an Advanced Diploma in Remote Sensing from NSCC COGS. With hands-on experience as a geologist and a deep interest in ground motion, he bridges geospatial insights with real-world understanding and client communication. When he's not decoding terrain shifts, Simon is likely out on a long-distance hike or building an intricate ship model.

Tushar Kumar Ram
Technical Content Writer
Tushar holds a B.Tech in Electrical Engineering from the Central University of Karnataka. Backed by experience in technical research and educational writing, he’s currently channeling that into helping KorrAI communicate their work and tech through sharp, user-first content. Off the clock, he dives into AI automations and mini robotics experiments, just for the joy of seeing ideas come to life.
Written By

Team KorrAI


.png)
We send the occasional email with updates, our latest blogs, and our favorite reads on risk intelligence in critical infrastructure, and mining.
Subscribe To Our Newsletter
Read by top professionals at
.webp)


Thank you! Your submission has been received!
Oops! Something went wrong while submitting the form.
.webp)
Traceable AI for billion-dollar builds.


Copyright
.svg)
2026 KorrAI